Description.
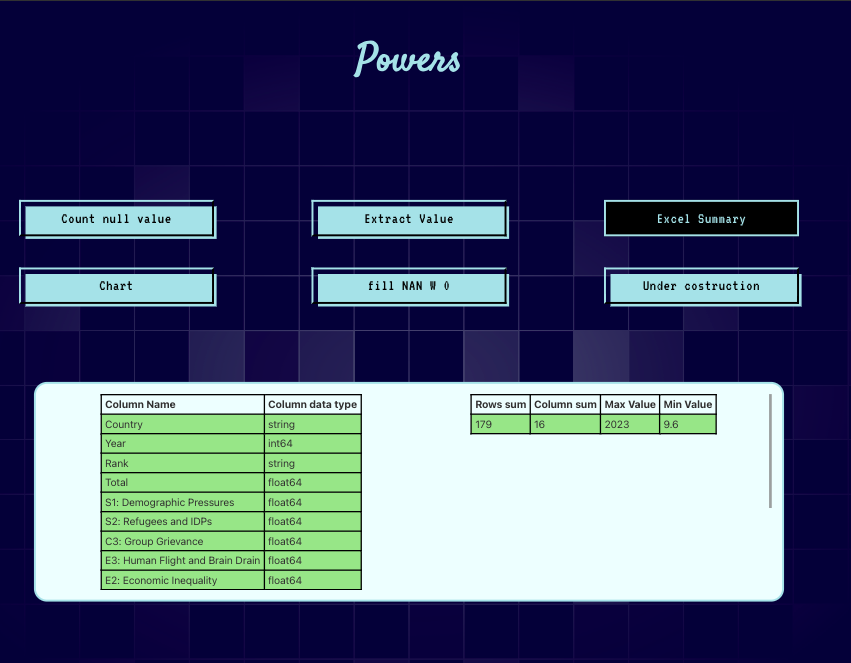
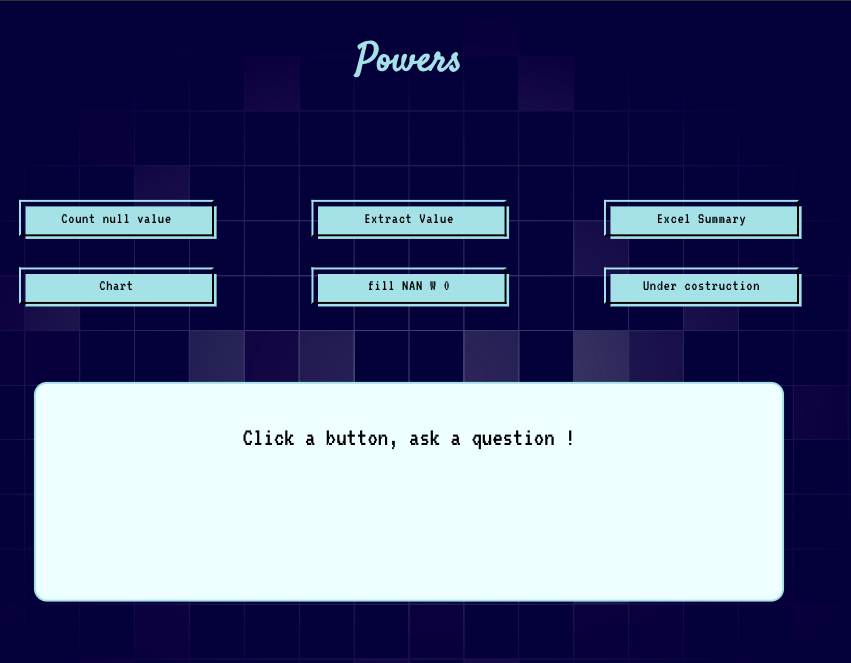
This frontend serves two primary and critical functions: processing an Excel file and handling JSON-formatted data received from the backend. The received data is utilized to create a summarized, tabular visualization of the Excel content, ensuring user-friendly data representation. The frontend operates in close connection with the backend project, Store, establishing a seamless backend-frontend integration to deliver an end-to-end solution as a final product.
This project is built using React for the user interface, Sass for styling, and Redux for state management.


Send the Excel
The ExcelAdIn component in React facilitates Excel file uploads and backend submission. It uses useState for managing file input, validation, and upload readiness, while useDispatch triggers Redux actions. The component validates files against .xlsx or .xls extensions and, upon validation, sends the file to the backend via a POST request at /excel, using FormData. It dynamically renders two views: a file input with a "Validate" button for initial upload and a "Start" button for submission. Modular CSS ensures styling, creating a user-friendly interface for seamless file upload and backend integration.
const ExcelAdIn = () => {
  const dispatch = useDispatch();

  const [validate, setValidate] = useState(false);
  const [isExcel, setIsExcel] = useState(false);
  const [excelFile, setExcelFile] = useState(undefined);

  const onSubmit = () => {
    if (excelFile !== undefined) {
      setIsExcel(true);
    }
  };

  const excelReader = () => {
    const allowedExtensions = ['.xlsx', '.xls'];

    if (excelFile && allowedExtensions.includes(excelFile.name.slice(-5))) {
      dispatch(excelAction.excelUpLoad(true));
      const formData = new FormData();
      formData.append('file', excelFile);
      fetch('#########', {
        method: 'POST',
        headers: {
          'Content-Type': 'application/json',
        },
        body: formData,
      }).then((response) => console.log(response.json()));
      console.log(formData);
    }
  };

  const start = (
    <div className={style.container}>
      <button className={style.start} onClick={excelReader}>
        Start
      </button>
    </div>
  );

  const addExcel = (
    <div className={style.container}>
      {!validate && (
        <div className={style.addExcel}>
          <label htmlFor="file-input" className={style.fileLabel}>
            Add Excel
          </label>
          <input
            type="file"
            accept=".xlsx, .xls"
            className={style.fileInput}
            onChange={(e) => {
              setExcelFile(e.target.files[0]);
              setValidate(true);
            }}
          />
        </div>
      )}
      {validate && (
        <button className={style.start} onClick={onSubmit}>
          Validate
        </button>
      )}
    </div>
  );

  return <Fragment>{isExcel ? start : addExcel}</Fragment>;
};

export default ExcelAdIn;
Custom Hook for Dynamic API Requests and Data Handling
The useQAfetch custom hook is designed to handle API interactions with a backend for various data retrieval or manipulation tasks related to Excel processing. It uses Redux's dispatch to update the application state based on the API responses. Here's a technical explanation:
-
Hook Structure: The hook defines an asynchronous function, fetchServer, which accepts a string parameter that determines the API endpoint or function to call.
-
Dynamic Endpoint Selection: Based on the provided string, the function appends it to a base URL to construct the endpoint dynamically. Specific cases, such as "Count null value," "Excel summary," and others, are handled with conditional logic.
-
API Call: It uses the fetch API to make HTTP GET requests to the backend. If the string corresponds to an "Under construction" case, it directly dispatches a placeholder response without making a request.
-
Response Parsing: The response status is validated, and errors are caught and handled gracefully. For valid responses, the JSON payload is parsed and structured into a standardized format, with fields like rows, columns, and max_value populated for specific strings.
-
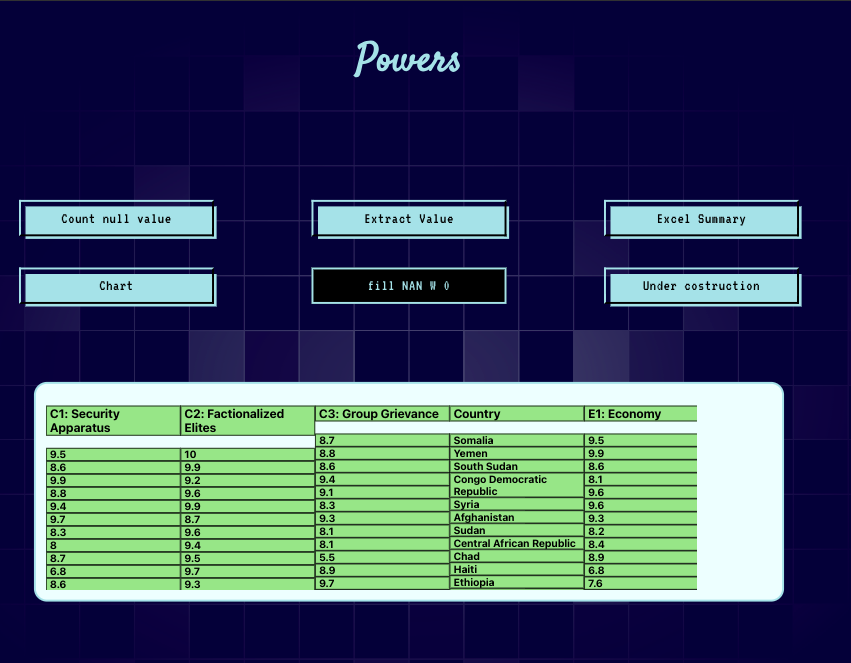
Data Dispatch: The parsed data is dispatched to the Redux store using an excelAction.excelResponse action. For "fill NAN W 0," the response is further processed into an array before dispatching.
-
Error Handling: If the request fails, the error message and response code are logged, and a standardized error response is dispatched to maintain consistency in the application's state.
-
Flexibility: By accepting a string parameter, the hook can reuse the same logic for different backend functionalities, reducing code duplication and enhancing maintainability.
This custom hook encapsulates API interaction logic, making it modular and easier to integrate into various components that need backend communication.
const useQAfetch = () => {
  const dispatch = useDispatch();

  const fetchServer = async (string) => {
    const url = '#########';
    let str = string;
    let responseCode;
    let dataRespons;
    let fillNan = [];
    try {
      let response;
      if (str === 'Count null value') {
        response = await fetch(url + str);
      } else if (str === 'Excel summary') {
        response = await fetch(url + str);
      } else if (str === 'Extract value') {
        response = await fetch(url + str);
      } else if (str === 'Chart') {
        response = await fetch(url + str);
      } else if (str === 'Under costruction') {
        dataRespons = {
          res: 'Under costruction',
          question: str,
        };
        console.log(dataRespons);
        dispatch(excelAction.excelResponse(dataRespons));
        return;
      } else if (str === 'fill NAN W 0') {
        response = await fetch(url + str);
      } else {
        response = await fetch(url + str);
      }

      responseCode = response.status;

      if (!response.ok) {
        throw new Error('Network response was not ok');
      }

      const data = await response.json();

      if (str === 'Count null value') {
        dataRespons = { res: data.value, question: str };
      } else if (str === 'Excel summary') {
        dataRespons = {
          rows: data.rows,
          columns: data.columns,
          col_dtypes: data.col_dtypes,
          max_value: data.max_value,
          min_value: data.min_value,
          question: str,
        };
      } else if (str === 'Extract value') {
        dataRespons = {
          value: data.value,
          columns: data.columns,
          row: data.row,
          question: str,
        };
      } else if ('fill NAN W 0') {
        dataRespons = data;
        for (const key in dataRespons) {
          fillNan.push({
            id: dataRespons[key].column,
            question: str,
            column: dataRespons[key].column,
            value: dataRespons[key].arr,
          });
        }
      } else if (str === 'Chart') {
        dataRespons = { res: data.value, question: str };
      } else {
        dataRespons = {
          res: data.value,
          question: str,
        };
      }

      if (str === 'fill NAN W 0') {
        dispatch(excelAction.excelResponse(fillNan));
      } else {
        dispatch(excelAction.excelResponse(dataRespons));
      }
    } catch (error) {
      console.log(error, responseCode);
      dataRespons = {
        res: `We tryed to call the server but the server code is ${responseCode}`,
        question: 'Error',
      };
      dispatch(excelAction.excelResponse(dataRespons));
    }
  };

  return { fetchServer };
};

export default useQAfetch;
Chart Configuration and Visualization
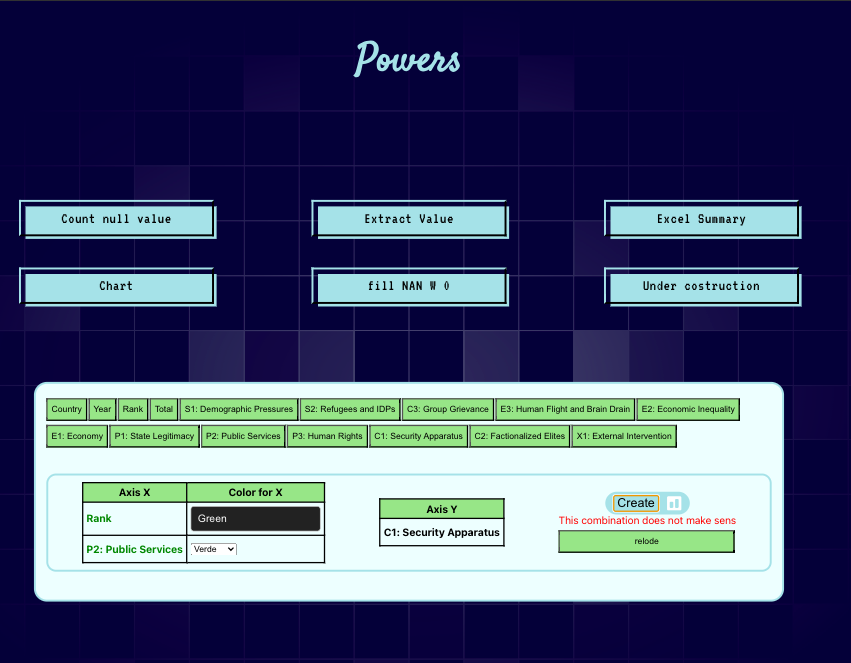
The ChartSettings component is responsible for configuring a chart based on the selected columns from an Excel file, interacting with a backend API. Using useSelector, it extracts data from the application state, including existing responses and current chart configurations. The user can select columns for the X and Y axes, as well as the colors associated with them. These settings are then sent to the backend via a POST request in JSON format. If the request is successful, an image file (the generated chart) is returned, processed, and displayed to the user. The component also includes options to reset the current configuration and displays error messages if the data is invalid or the server request fails. All of these operations are handled using React, with state management via useState and useDispatch, and the interface dynamically updates as the user interacts with the data selection components.
const ChartSettings = () => {
  const arr = useSelector((select) => select.exe.excelResponse);
  const c = useSelector((state) => state.exe.chart);
  const dispatch = useDispatch();
  const [colXoane, setColXoane] = useState('');
  const [colXtow, setColXtow] = useState('');
  const [colY, setColY] = useState('');
  const [full, setFull] = useState(false);
  const [imageData, setImageData] = useState(null);
  const [s, setS] = useState(false);
  const [err, setErr] = useState(false);

  const [selectedColorXoane, setSelectedColorXoane] = useState('Blue');
  const [selectedColorXtow, setSelectedColorXtow] = useState('Blue');

  const handleColorChangeXoane = (event) => {
    setSelectedColorXoane(event.target.value);
  };
  const handleColorChangeXtow = (event) => {
    setSelectedColorXtow(event.target.value);
  };

  const setCol = (name) => {
    if (colXoane === '') {
      setColXoane(name);
    } else if (colXtow === '') {
      setColXtow(name);
      setFull(true);
    } else if (colXoane !== '' && colXtow !== '') {
      return;
    }
  };

  const setY = (name) => {
    setColY(name);
  };

  const json = {
    columnX1: [colXoane, selectedColorXoane],
    columnX2: [colXtow, selectedColorXtow],
    Y: colY,
  };

  const createChart = async () => {
    try {
      const response = await fetch('#########', {
        method: 'POST',
        headers: {
          'Content-Type': 'application/json',
        },
        body: JSON.stringify(json),
      });

      if (!response.ok) {
        throw new Error('Eroare la cerere');
      }
      const blob = await response.blob();
      const imageUrl = URL.createObjectURL(blob);
      setImageData(imageUrl);
      dispatch(excelAction.chart(true));
      setS(true);
    } catch (error) {
      console.error(`An error occurred: ${error.message}`);
      setErr('This combination does not make sens');
    }
    console.log(json);
  };
  const restore = () => {
    setColXoane('');
    setColXtow('');
    setColY('');
    setFull(false);
    setImageData(null);
    setS(false);
    setSelectedColorXoane('Blue');
    setSelectedColorXtow('Blue');
    dispatch(excelAction.chart(false));
    setErr(false);
  };

  const relode = (
    <button className={btn.btn} onClick={restore}>
      relode
    </button>
  );

  const colNames = arr.res.map((el) => (
    <ChartBtn key={el} name={el} col={el} onClick={full ? setY : setCol} />
  ));

  const tablesChios = (
    <>
      <table className={style.tableConatiner}>
        <thead>
          <tr>
            <th className={style.thead}>Axis X</th>
            <th className={style.thead}>Color for X</th>
          </tr>
        </thead>
        <tbody>
          <tr>
            <td
              className={style.tableContent}
              style={{ color: selectedColorXoane, fontWeight: 'bold' }}
            >
              {colXoane}
            </td>

            <td className={style.tableContent}>
              <select
                className={style.select}
                value={selectedColorXoane}
                onChange={handleColorChangeXoane}
              >
                <option className={style.option} value="Blue">
                  Blue
                </option>
                <option className={style.option} value="Red">
                  Red
                </option>
                <option className={style.option} value="Green">
                  Green
                </option>
                <option className={style.option} value="Yellow">
                  Yellow
                </option>
              </select>
            </td>
          </tr>
          <tr>
            <td
              className={style.tableContent}
              style={{ color: selectedColorXtow, fontWeight: 'bold' }}
            >
              {colXtow}
            </td>

            <td className={style.tableContent}>
              <select
                value={selectedColorXtow}
                onChange={handleColorChangeXtow}
              >
                <option value="Blue">Albastru</option>
                <option value="Red">Roșu</option>
                <option value="Green">Verde</option>
                <option value="Yellow">Galben</option>
              </select>
            </td>
          </tr>
        </tbody>
      </table>
      <table className={style.tableConatiner}>
        <thead>
          <tr>
            <th className={style.thead}>Axis Y</th>
          </tr>
        </thead>
        <tbody>
          <tr>
            <td className={style.tableContent} style={{ fontWeight: 'bold' }}>
              {colY}
            </td>
          </tr>
        </tbody>
      </table>
    </>
  );

  const img = (
    <div className={style.imgChart}>
      {imageData && (
        <img className={style.img} src={imageData} alt="Descriere imagine" />
      )}
    </div>
  );

  const chart = (
    <div className={style.create}>
      <div className={style.chartContainerBtn}>
        <svg
          className={style.svgBtn}
          version="1.1"
          xmlns="http://www.w3.org/2000/svg"
          width="22"
          height="22"
          viewBox="0 0 32 32"
        >
          <path d="M29 0h-26c-1.65 0-3 1.35-3 3v26c0 1.65 1.35 3 3 3h26c1.65 0 3-1.35 3-3v-26c0-1.65-1.35-3-3-3zM14 24c0 1.1-0.9 2-2 2h-4c-1.1 0-2-0.9-2-2v-16c0-1.1 0.9-2 2-2h4c1.1 0 2 0.9 2 2v16zM26 18c0 1.1-0.9 2-2 2h-4c-1.1 0-2-0.9-2-2v-10c0-1.1 0.9-2 2-2h4c1.1 0 2 0.9 2 2v10z"></path>
        </svg>
        <button onClick={createChart} className={style.chartBtnStart}>
          Create
        </button>
      </div>
      {err && (
        <div style={{ display: 'flex', flexDirection: 'column' }}>
          <span style={{ color: 'red' }}>{err}</span>
          {relode}
        </div>
      )}
    </div>
  );

  return (
    <>
      {!s && colNames}
      {s && relode}
      <div className={s ? style.imgContainer : style.chartContainer}>
        {!s && tablesChios}
        {s ? img : chart}
      </div>
    </>
  );
};

export default ChartSettings;
Conclusion:
The front-end implementation demonstrates a well-structured and interactive approach for handling data visualization. It allows users to dynamically select columns for chart creation, customize colors, and submit requests to the backend. The component handles responses efficiently, displaying the generated chart as an image. With a focus on flexibility, it supports multiple combinations of input data and ensures proper error handling to provide a smooth user experience. The inclusion of a reset functionality allows for easy restoration of settings. This front-end approach integrates effectively with the backend, ensuring the process from data selection to chart generation is seamless, intuitive, and user-friendly.

